How the black hole was made
updated 2026-10-07
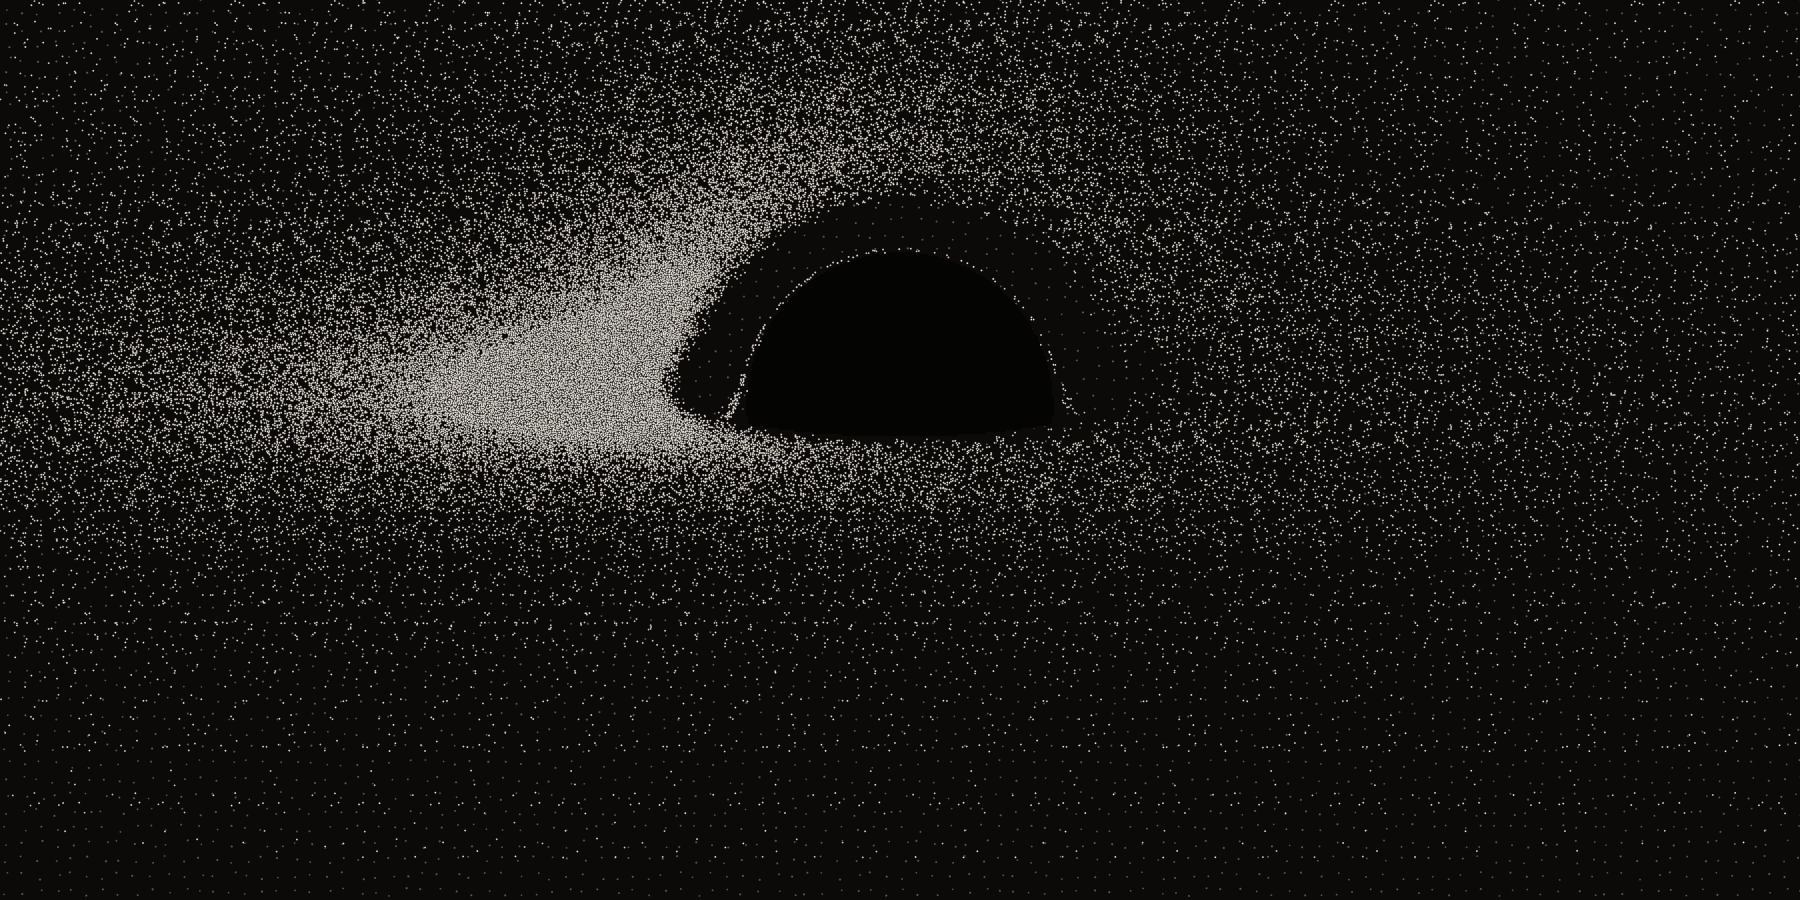
The band above, and across the top of the home page, isn't a picture of a black hole. It's a calculation of one, redone by your browser's graphics processor every time the page loads, following a paper published in 1979. This page goes from that paper to the code that runs it and the server that sends it to you.
1. The 1979 plate
In 1978 Jean-Pierre Luminet, a young astrophysicist at the Paris-Meudon Observatory, set out to answer a simple question: what would a black hole actually look like? A bare black hole is just a hole in the starfield. But gas spiralling into one settles into a thin, flat, very hot disk, and that disk shines. His answer appeared the next year in Astronomy & Astrophysics as "Image of a spherical black hole with thin accretion disk."
The paper works in three steps, and so does the code:
- Where the light goes. Near a black hole, spacetime is curved and light travels along bent paths. Luminet computed those paths and plotted isoradials: for each ring of the disk, the curve on the observer's sky where that ring appears.
- How bright it looks. Each ring of the disk radiates according to the theory of Page and Thorne (1974), and its light is shifted on the way out — redder for climbing out of the hole's gravity, bluer or redder depending on whether the gas is coming toward us or going away. He plotted the result as isophotes, curves of equal apparent brightness.
- The picture. He ran the numbers on an IBM 7040 fed with punched cards, but no computer of the day could draw a halftone image. So he drew it by hand: India-ink dots on gridded Canson paper, more dots where the disk was brighter, then photographed the sheet as a negative so the ink came out as light.
Everything people now associate with black-hole pictures is already in his plate: the dark shadow; the far side of the disk bent up into an arch over the top of the hole; one side of the disk far brighter than the other; and a thin bright line hugging the shadow. Forty years later, the Event Horizon Telescope's first image of a real black hole showed the same lopsided ring.
2. The physics
Units
Everything is measured in units of the hole's mass, with the gravitational constant and the speed of light set to 1, so a length of "1 M" means GM/c² — 1.5 km for a hole as heavy as the Sun. The picture is the same for every mass; only the scale changes. A non-rotating (Schwarzschild) black hole has three radii that matter here:
| Radius | Name | What happens there |
|---|---|---|
| 2M | event horizon | nothing comes back out |
| 3M | photon sphere | light can circle the hole, unstably |
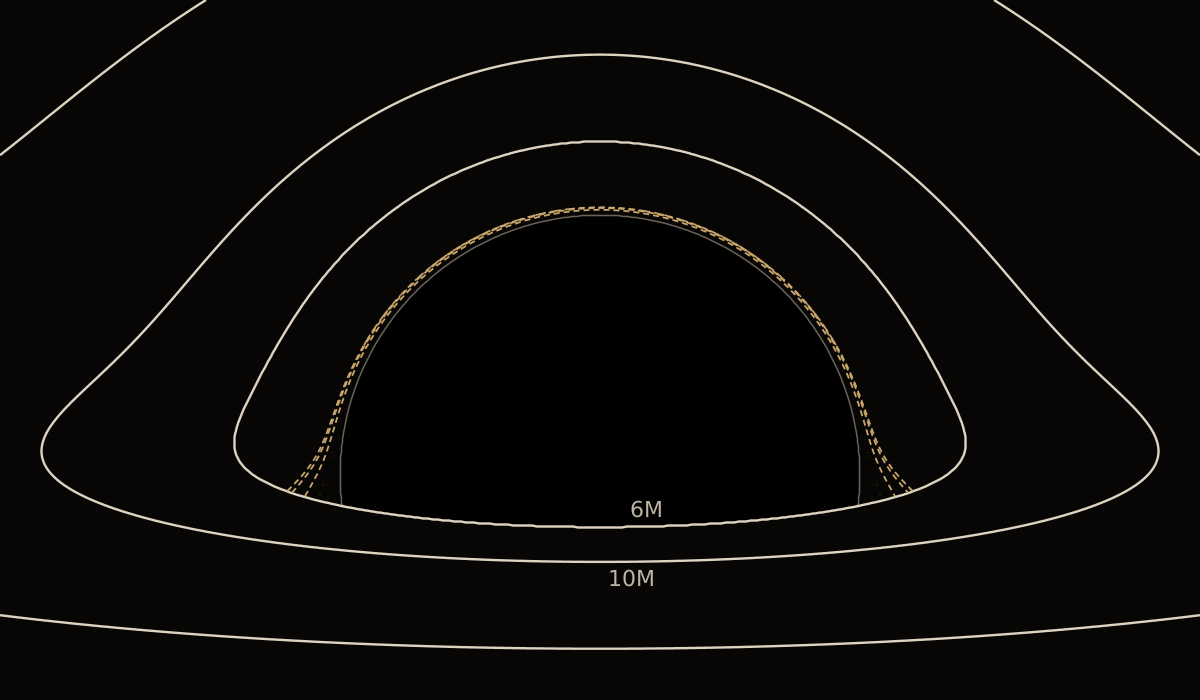
| 6M | innermost stable circular orbit | gas can't orbit any closer: the disk's inner edge |
Bent light
A ray of light passing the hole stays in one plane. Writing u = M/r for the inverse distance from the hole and φ for the angle the ray has swept around it, its path obeys
d²u / dφ² = 3u² − u
Without the 3u² term this is the equation of a straight line; that one term is all of general relativity's light-bending. The ray's impact parameter b — how far from the centre it would pass if it went straight — sets the starting slope, through (du/dφ)² = 1/b² − u²(1 − 2u). Rays aimed closer than b = 3√3 M ≈ 5.2M spiral in and are lost, which makes the shadow about 10.4M across.
Luminet solved this equation in closed form, with elliptic integrals. The code integrates it numerically instead (section 4). On a graphics card that costs almost nothing, and the same loop finds every image of the disk at once.
The disk
The disk is thin and flat, lies in the hole's equatorial plane, and runs from 6M outward. Its gas moves on circular orbits with angular velocity Ω = √(M/r³). That is Kepler's third law, and it happens to stay exact around a Schwarzschild hole when time is measured by a distant clock.
How much light each ring gives off
Gas drifting inward through the disk turns gravitational energy into heat and radiates it. Page and Thorne worked out exactly how much, per unit area of the disk, from conservation of energy and angular momentum alone. For a non-rotating hole, with r in units of M:
F(r) ∝ [ √r − √6 + (√3⁄2) ln ( (√r + √3)(√6 − √3) ⁄ ((√r − √3)(√6 + √3)) ) ] ⁄ ( (r − 3) r5/2 )
It is zero at the inner edge, peaks at r = 9.55M, and falls off as r−3 far out. Luminet gave every brightness in units of that peak, Fmax, and so does the code.
How much of it arrives
A photon leaving the disk at radius r reaches us with its frequency multiplied by
g = √(1 − 3M⁄r) ⁄ (1 + Ω x cos ε)
where x is how far left or right of centre the photon arrives on our sky and ε = 10° is our height above the disk's plane (x cos ε is the photon's angular momentum about the disk's axis). The square root is gravitational redshift combined with the time dilation of the moving gas; the denominator is the Doppler shift. Because Iν⁄ν³ is conserved along a light ray, the total brightness we receive scales as the fourth power:
Fobs = g4 F(r)
That fourth power makes the picture lopsided. In this picture the disk turns so that the gas on the left comes toward us. At the peak radius, that side gets g⁴ ≈ 2.2 and the receding side gets g⁴ ≈ 0.16 — about fourteen times dimmer. The brightest point on the whole disk comes out at 2.2 Fmax, the top of Luminet's isophote scale.
More than one image
The far half of the disk, behind the hole, would be hidden if light travelled straight. Instead its light is bent over the top of the hole, so each ring appears lifted into an arch above the shadow:
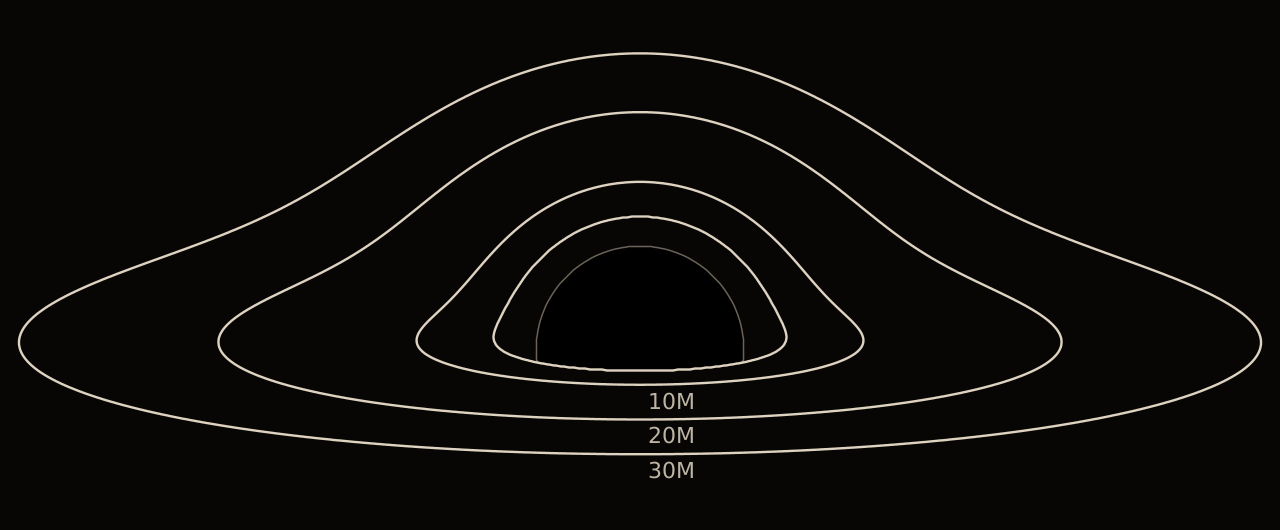
A ray can also pass close to the hole, swing around it, and land on the disk's lower face. That is the secondary image, squeezed into a thin crescent just outside the shadow — the thin bright line in Luminet's plate. Rays that loop around once more make a third image, each next order about 1⁄23 (e−π) as wide as the one before, all piling up against the edge of the shadow. Luminet left the third and higher orders dark, and so does the code.
3. From physics to the plate
To redraw Luminet's plate rather than invent a new picture, the code keeps his choices:
- the observer is far away (parallel rays), 10° above the disk;
- the frame is 61M wide at 2:1, with the hole a little above the middle, so the shadow spans about 17% of the width, as in the original;
- the disk starts at 6M and runs out past the frame, simply fading;
- brightness is in units of Fmax, and the density of dots is proportional to apparent brightness, saturating at 1.5 Fmax;
- the shadow and the higher-order images stay blank;
- under everything is the faint grid of his paper.
4. The implementation
The band is one JavaScript module, public/js/blackhole.js, about 530 lines, using three.js for the WebGL2 plumbing. Most of the work happens in two passes, run when the page loads or the band changes size; after that, each frame takes two draw calls.
Pass 1 — trace the light
One ray per 2×2 block of screen pixels (finer on a phone, so there are always at least 1,200 rays across), each one a run of the GPU's fragment shader:
- Start the ray 130M from the hole, parallel to the line of sight, offset by its position on the sky.
- The ray's starting point and direction define its plane; its impact parameter is the length of their cross product.
- Integrate the light-bending equation with fourth-order Runge–Kutta, in steps of 0.03 radian, for up to 800 steps (3.8 turns around the hole).
- Stop when u > 0.5 (inside the horizon: shadow), when the ray heads back out past 195M (escaped), or when it crosses the disk's plane between 6M and 90M: a hit. Plane crossings that miss the disk are counted. None before the hit means the primary image, one means the secondary image, and more means a higher order, left dark.
- For a hit, store the apparent brightness g⁴F⁄Fmax, the disk radius and azimuth where the ray landed, and the image order.
The traced field runs 1M past every edge of the band, so gas about to orbit into view already has somewhere to be drawn.
Pass 2 — turn the map inside out
The trace answers "for this point on the screen, where on the disk am I looking?" To animate the disk, the code needs the opposite: "for this piece of gas, where on the screen does it appear?" Inverting a gravitational lens map is the hardest part of the whole thing, and it's where most of the work went.
The solution is to let the graphics card's rasterizer do it. Every 2×2 square of traced cells becomes two triangles. Instead of drawing them at their screen positions, the shader places their corners at their disk coordinates (r, φ) in a lookup table — 256 radii by 1,536 azimuths per image, with the primary and secondary images side by side. Each table entry covered by a triangle then works out where its own (r, φ) lands on screen. From each of the triangle's three corners it takes a first-order step, using that corner's Jacobian ∂(x, y)⁄∂(r, φ) (found by central differences over the traced field, then inverted). It blends the three answers by barycentric weight, then stores the screen position and the Jacobian, two outputs at once using multiple render targets.
Triangles whose corners disagree about which image they belong to, or touch the shadow, are skipped, so the images never mix. Triangles that straddle φ = 0 are drawn a second time, shifted by a full turn, so the table wraps around without a seam.
The paper
A fragment shader draws a faint lattice of dots every 23 device pixels, slightly irregular, at about a third of the ink's strength and blank inside the shadow: Luminet's gridded paper.
The dots
There are 400,000 parcels of gas. Each has a fixed radius r, a starting azimuth φ0 and a random number between 0 and 1. Radii are drawn with probability ∝ r−3/2, so more parcels sit near the hole, where the light is.
Each frame, a parcel's azimuth is φ0 − Ω(r)·t: it orbits at its own Keplerian speed (5M of time per second of yours), so the inner gas laps the outer. The vertex shader blends the four nearest table entries to find where the parcel appears on screen, and the local Jacobian J there.
Whether to draw it comes down to keeping the plate's dot density. The patch of disk behind one 2-pixel cell has area A = (cell area)⁄|det J|, and so holds n(r)·A parcels on average, where n(r) is how many parcels there are per unit of r and φ. The plate wants 1.4 dots in that cell at full brightness. So each parcel is drawn when its random number is below
p = 1.4 · min(1, Fobs ⁄ 1.5Fmax) ⁄ ( n(r) A )
Individual dots stream along their orbits, but the density in every cell is the plate's at every instant.
The secondary image is drawn in a second pass from its own table. On a small screen it would come out thinner than a dot, so its density is boosted there to keep the line weight it has on a large plate.
There is one deliberate departure from the physics. Dots on the receding side are also drawn fainter, by the square of the Doppler factor, on top of the change in density. The g⁴ in the density is already the real effect; the extra fading just makes it readable at a glance.
Manners
- Colours come from the site's stylesheet and follow the light/dark toggle.
- The animation pauses when it's scrolled out of view or the tab is hidden, and shows a single still frame if you've asked your system for reduced motion.
- The pixel ratio is capped at 2. Tables use 32-bit float textures, falling back to 16-bit where 32-bit isn't supported.
- Without WebGL2 you see a static plate, rendered ahead of time by
scripts/render-blackhole.js, a Node twin of the shader with the same trace and the same flux. The figures on this page come fromscripts/render-blackhole-figures.js, which uses the same ray tracer.
5. Getting it right
The band went through ten versions over two days. The first was a shaded, stippled rendering you could tilt by dragging. Joseph turned down, one after another, a shimmer from re-randomising the dots, stripes along the isoradials, a lensed star field and the tilt control. What he wanted was Luminet's plate itself, so the next version started over from the paper (section 3) and set the dots in motion.
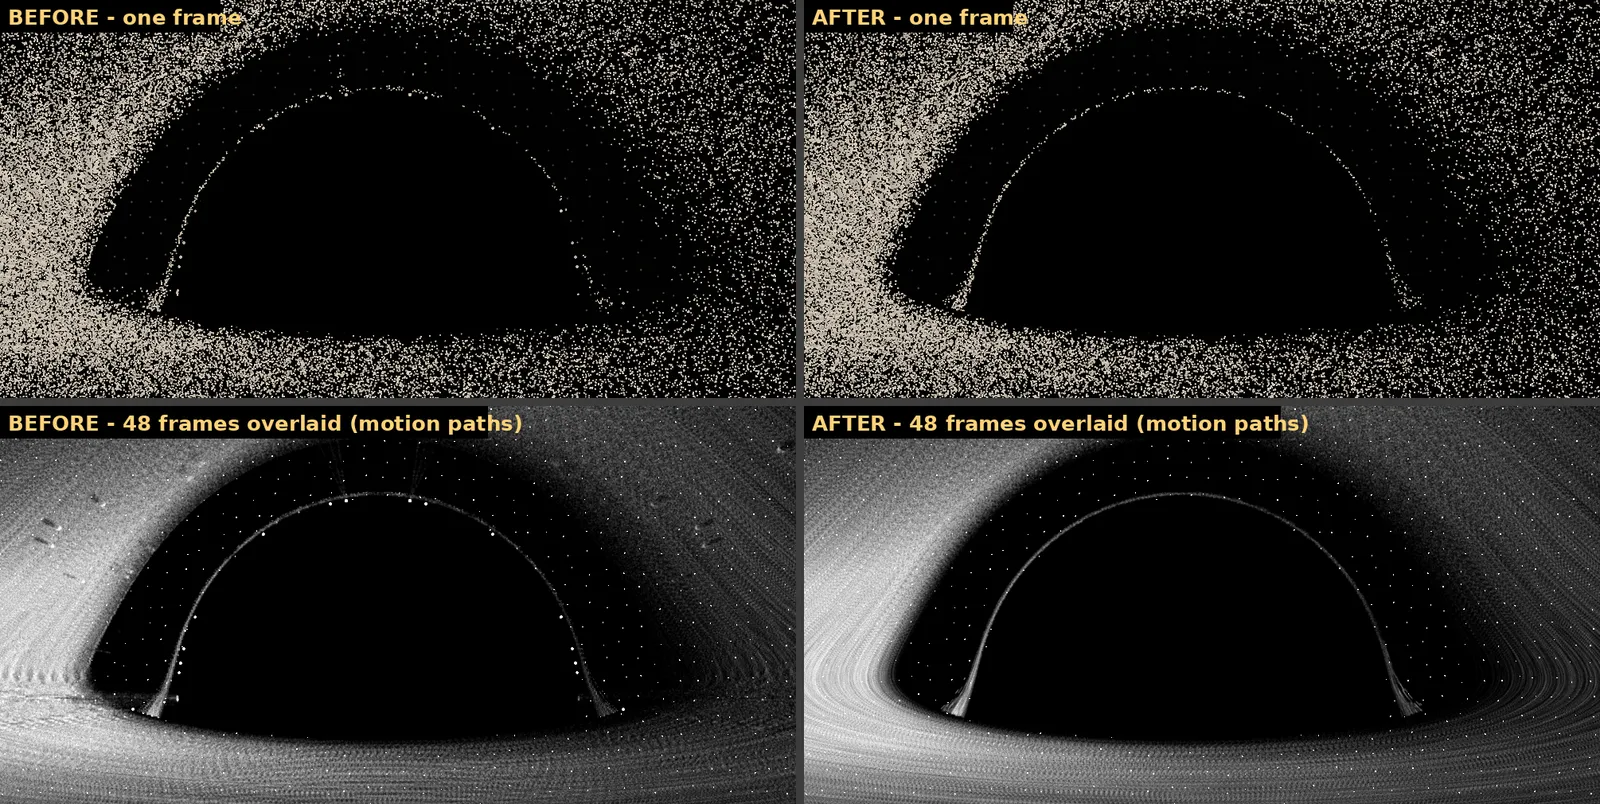
That brought on the hard problem: the inverse map. The first inversion scattered each traced cell into the table and filled in the gaps, and it drew radial spokes above the shadow. Averaging overlapping writes removed the spokes. Switching from 16- to 32-bit floats removed a fine mesh of arcs, since 16-bit positions are only good to about half a pixel. Four artifacts remained, all from the same scatter-and-fill table:
- radial streaks above the shadow: a higher-order image lands on the same face of the disk as the primary, and the two were averaged together, so parcels slid along lines between them, up to 180 pixels off their orbits;
- horizontal seams at the hole's height: where one traced cell spans several table entries the table had holes, and the fill copied neighbours, so parcels stalled and then jumped, lining up into seams;
- thick dots stuck on the photon ring: the secondary image was almost all holes and copies;
- dots piling up on the band's edges: the fill extrapolated past the frame.
The mesh inversion described in section 4 replaced all of it: there are no holes to fill, nothing is averaged, and the images never mix.
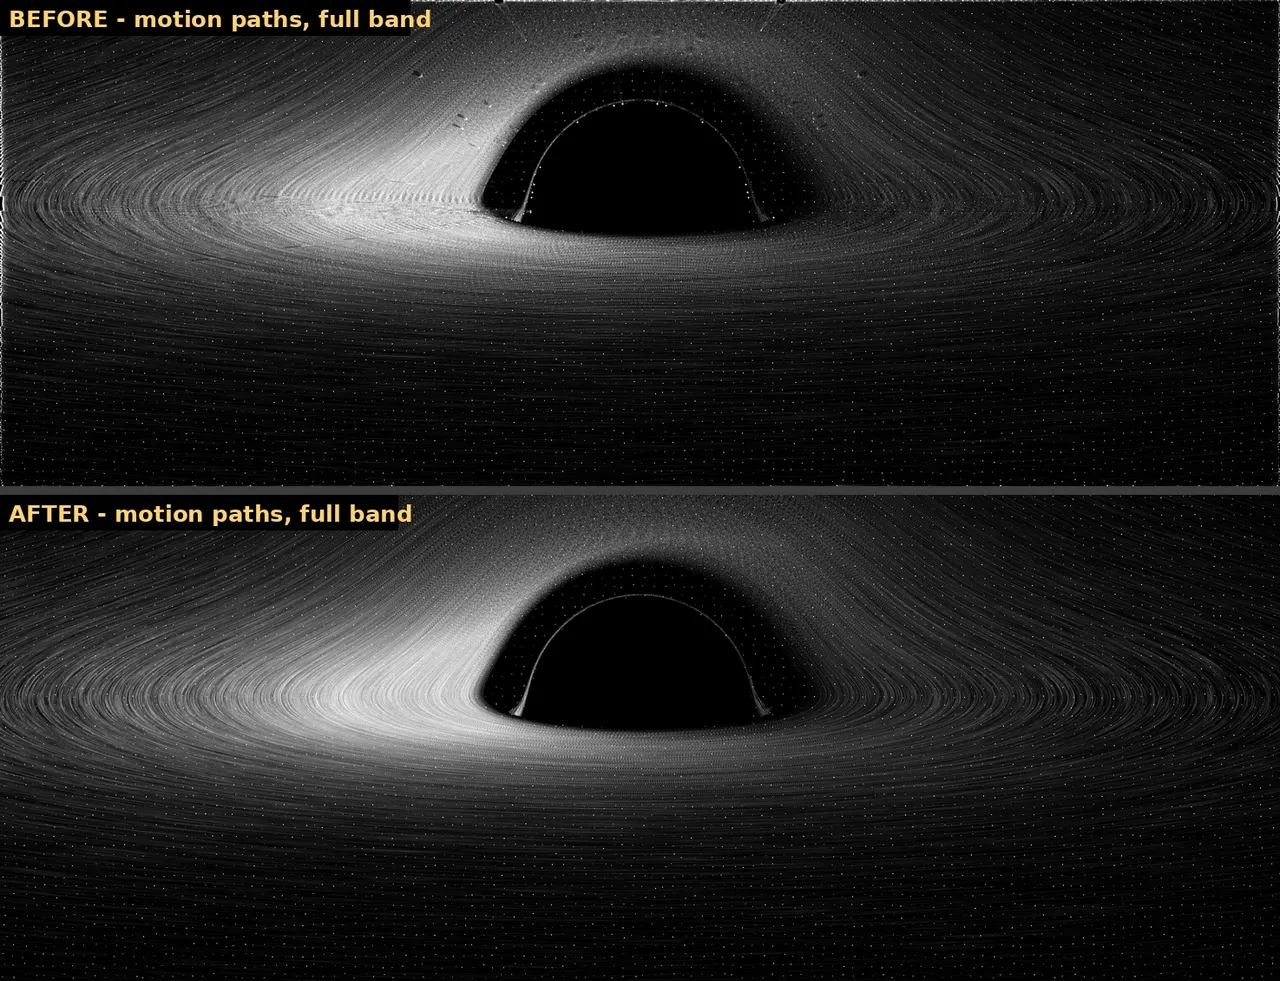
The last change was a matter of taste. For a while, in the light theme, the band was ink on cream paper, the way Luminet drew it. Then it went back to the photographic negative he published.
6. Checking it
You can't eyeball a 400,000-dot animation for mistakes, so the fixes were measured. The server has no graphics card. Instead it runs headless Chromium with SwiftShader, a software implementation of WebGL, with the page's clock stubbed out so that every frame can be reproduced exactly. Over 48 frames at 1475×560 (2× pixel ratio):
| Measure | Before | After |
|---|---|---|
| bright pixels lit in at least 90% of frames (dots that never move) | 1,347 | 29, none at the edges |
| parcels that stalled between frames | 72,952 | 0 |
| worst distance of a parcel from its own orbit | 183 px | 0.5 px |
The traced field and the lookup tables were also read back off the graphics card and inspected directly.
7. How it reaches you
The server computes none of the black hole. Every ray and every dot is worked out on your device. For the black hole, the server only sends three files along with the page: blackhole.js; a copy of three.js hosted here rather than on a CDN, so loading the page makes no third-party requests; and the fallback plate.
The site itself is a small Node and Express app. It runs in a Docker container on a server in the corner under the desk, with a read-only filesystem, no special Linux privileges and an unprivileged user. Its words, including this page, are Markdown files in a git checkout mounted into the container, so fixing a sentence needs no rebuild. Code changes ship as a new container image (this page arrived with version 0.2.11). In front of it, a Cloudflare Tunnel carries traffic to Nginx Proxy Manager, and Authelia decides who gets to see what.
Sources
- J.-P. Luminet, "Image of a spherical black hole with thin accretion disk," Astronomy & Astrophysics 75, 228–235 (1979).
- J.-P. Luminet, "An Illustrated History of Black Hole Imaging: Personal Recollections (1972–2002)," arXiv:1902.11196 (2019) — his own account of how the image was made.
- E. Skulberg and M. Sparre, "A Black Hole in Ink: Jean-Pierre Luminet and 'Realistic' Black Hole Imaging," Historical Studies in the Natural Sciences 53(4), 389–424 (2023), doi:10.1525/hsns.2023.53.4.389.
- D. N. Page and K. S. Thorne, "Disk-accretion onto a black hole. Time-averaged structure of accretion disk," The Astrophysical Journal 191, 499–506 (1974).
Credits
Physics and the original image: Jean-Pierre Luminet. Code, figures and this write-up: Claude, Anthropic's AI, working in Claude Code. Direction, taste and the final say: Joseph.